
Real estate in Italy in 2025 – market analysis

July 18, 2025
UDOSTĘPNIJ NA:
Buying a property in Italy has been stirring the imagination of many Poles for years – and it’s hardly surprising. With its warm climate, rich culture, picturesque landscapes and world-loved Italian cuisine, Italy is seen not only as an ideal vacation destination, but increasingly also as an attractive place to live or invest.
To help you make informed decisions about buying property in Italy, here are key data from a recent report prepared by the Real Estate Observatory (OMI) under the Italian Revenue Service (Agenzia delle Entrate). The publication was released in May of this year and contains comprehensive data for 2024: both statistics for individual regions and selected cities, as well as comparative analysis from 2004-2024.
Importantly, the report is based not only on actual transaction prices recorded in the tax system. Thanks to its cooperation with the Italian Banking Association, it also takes into account data from the banking sector, which finances about 40% of housing transactions in the country. This makes the published report a detailed and reliable source of information on the current situation in the Italian real estate market.
1. Property prices in Italy – an introduction
While there is no shortage of information on property prices in Italy on the web – especially on popular advertising portals such as idealista.it, casa.it and immobiliare.it – it is worth remembering that they mainly present offer prices, which do not always reflect reality. This is because they are the starting point for negotiations and are usually higher than transaction prices.
Therefore, when deciding whether to buy or sell a property, it is worth reaching for data from various sources, paying special attention to their reliability. Of key importance in this context is precisely the OMI report, based on actual transaction prices, which allows you to better understand the actual level of prices in the market.
The differences can be significant – according to the OMI report, in 2024 the average price of a property was €158,600, which, with the average area of units sold (106 sq m), comes to €1,496/m². Meanwhile, data from idealista.it shows a unit price of €1,880/m², which is as much as 25% higher. For sellers, knowledge of this data is a valuable hint for the correct valuation of a property, and for buyers – it can be an important argument in negotiations.
2. How has the Italian residential real estate market changed over the past 20 years?
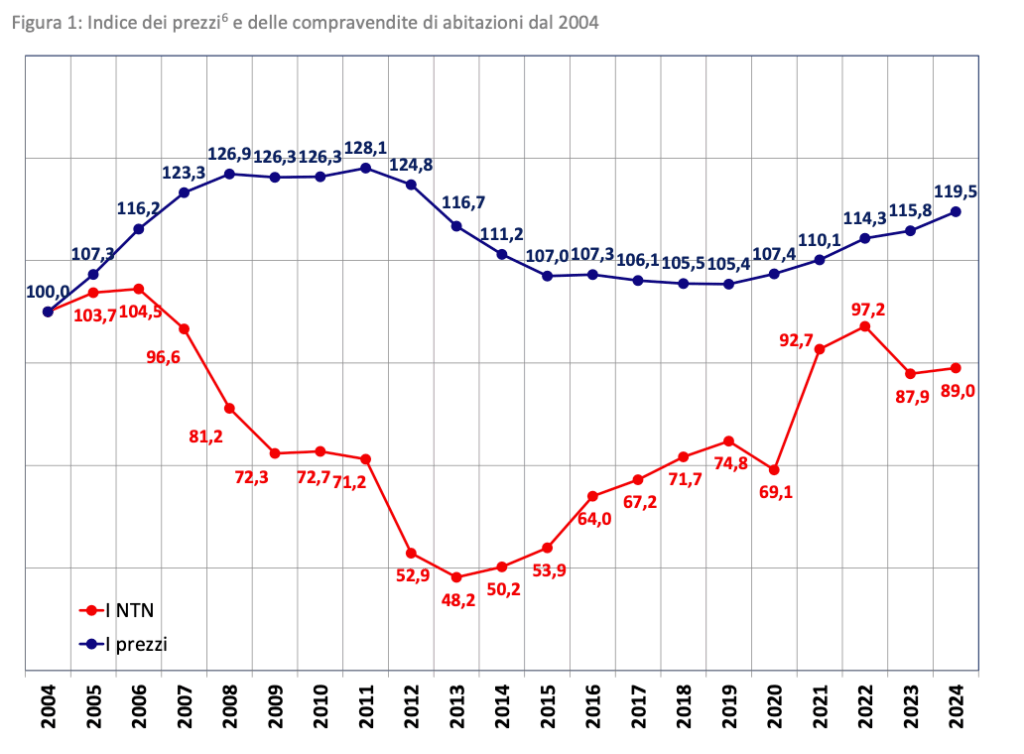
Stable growth -> 2008 crisis -> A sharp reduction in the number of transactions and a drop in prices -> stagnation -> pandemic covid-19 -> Temporary destabilization of the market -> revival – That’s how the evolution of the market since 2004 can be described in a nutshell:
- 2007-2013: a sharp drop in the number of transactions by more than half and a 20% drop in prices as a result of the ongoing 2008 global financial crisis.
- 2013–2019 r.: The beginnings of a market recovery in the form of an increasing number of transactions, with no price reaction
- 2019–2023 r.: a short-term drop in the number of transactions due to the outbreak of the pandemic, followed by a dynamic increase in the number of transactions and a gradual increase in prices in subsequent years
- 2024 r.: Prices approaching pre-crisis 2008 levels
📈 The chart below (Figure 1) shows how the price index (blue chart) and the number of transactions (red chart) have changed relative to 2004.
ITALIAN HOUSING MARKET IN 2024
3. Where did the most transactions take place?
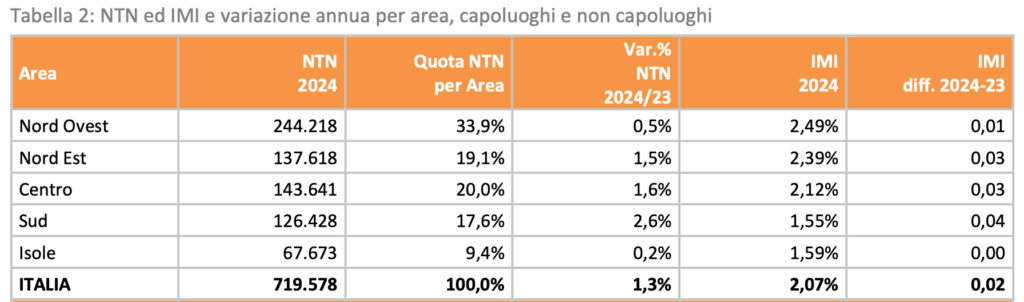
In 2024, a total of more than 719,000 transactions in the Italian housing market, and the undisputed leader is the northern part of the country, which accounts for more than half of all transactions.
📈 The table below (Tabella 2) shows the number of transactions in 2024 (NTN 2024) by region (Nord Ovest – northwest, Nord Est – northeast, Centro – center, Sud – south, Isole – islands).
4. In which cities were the most properties sold in 2024?
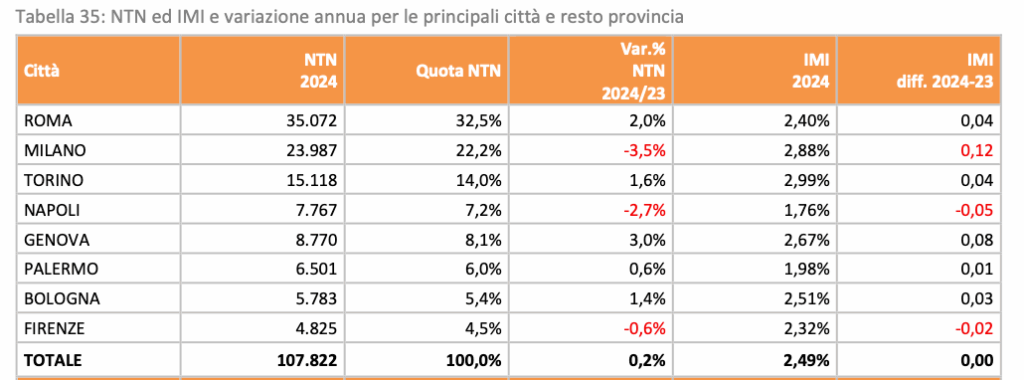
The distribution of transactions by the 8 largest Italian cities is as follows: Rome and Milan, as the two largest centers, account for more than half of the transactions – 35,072 and 23,987, respectively. Of particular note in this context is Turin, which ranked 3rd with 15,118 transactions.
📈 The table below (Tabella 35) shows the number of transactions in 2024 (NTN 2024) by the eight largest Italian cities.
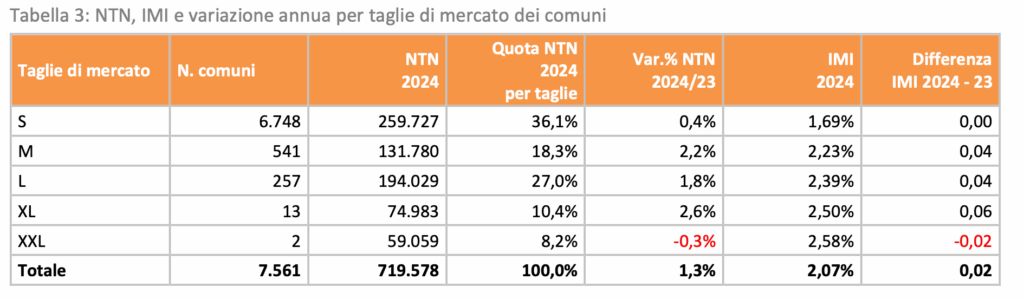
Interestingly, in Italy, an important role in the residential real estate market is played by the smallest towns (S), as this is where the most transactions took place – as much as 36.1% which translates into more than 250,000 properties sold.
📈 The table below (Tabella 3) shows the number of transactions in 2024 (NTN 2024) by city size – S, M, L, XL, XXL.
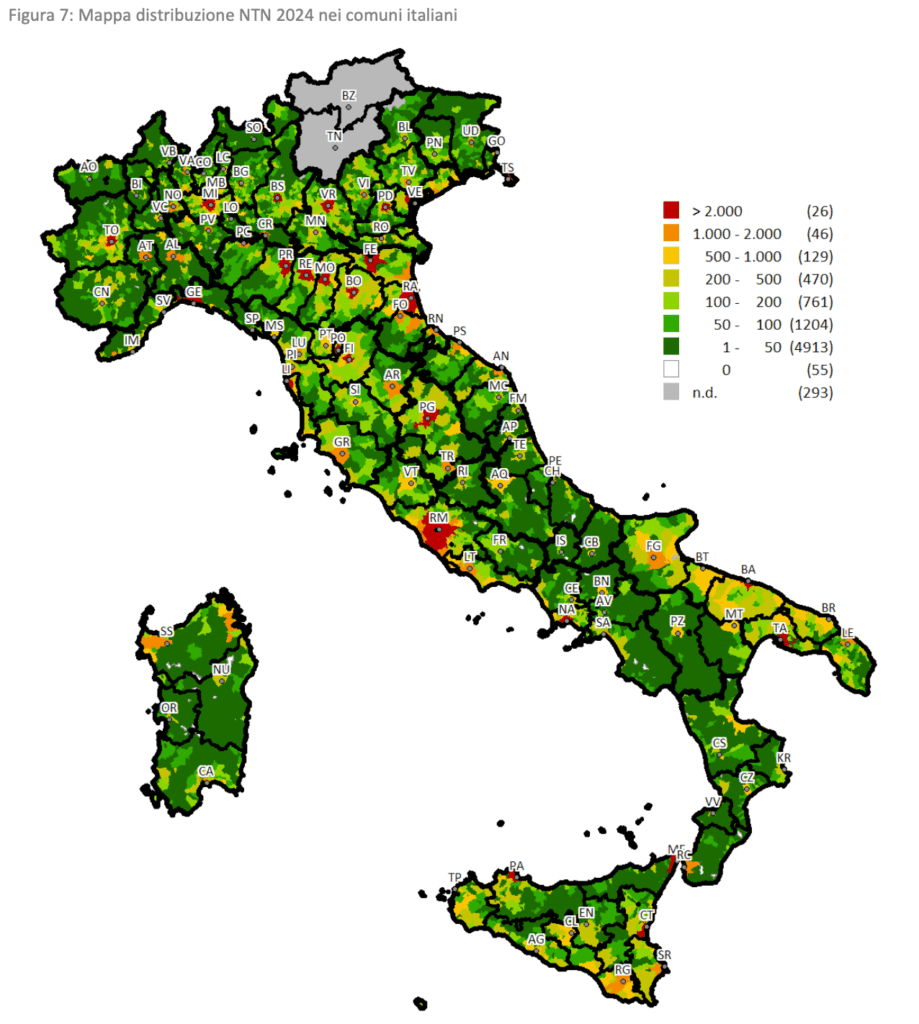
5. Which regions were particularly active in 2024 in terms of the number of transactions?
In addition to the largest urban centers, where, due to their size, the number of transactions tends to be the highest, such as the aforementioned Rome and Milan, several particularly active regions are clearly marked:
- Apulia (Bari)
- South Sicily
- North of Sardinia (Sassari, Costa Smeralda)
- West and East Coast ( along the regions: Tuscany, Lazio, Campania, Veneto, Emilia-Romagna, northern Marche)
📈 The map below (Figure 7) shows the number of transactions in 2024 in each Italian municipality.
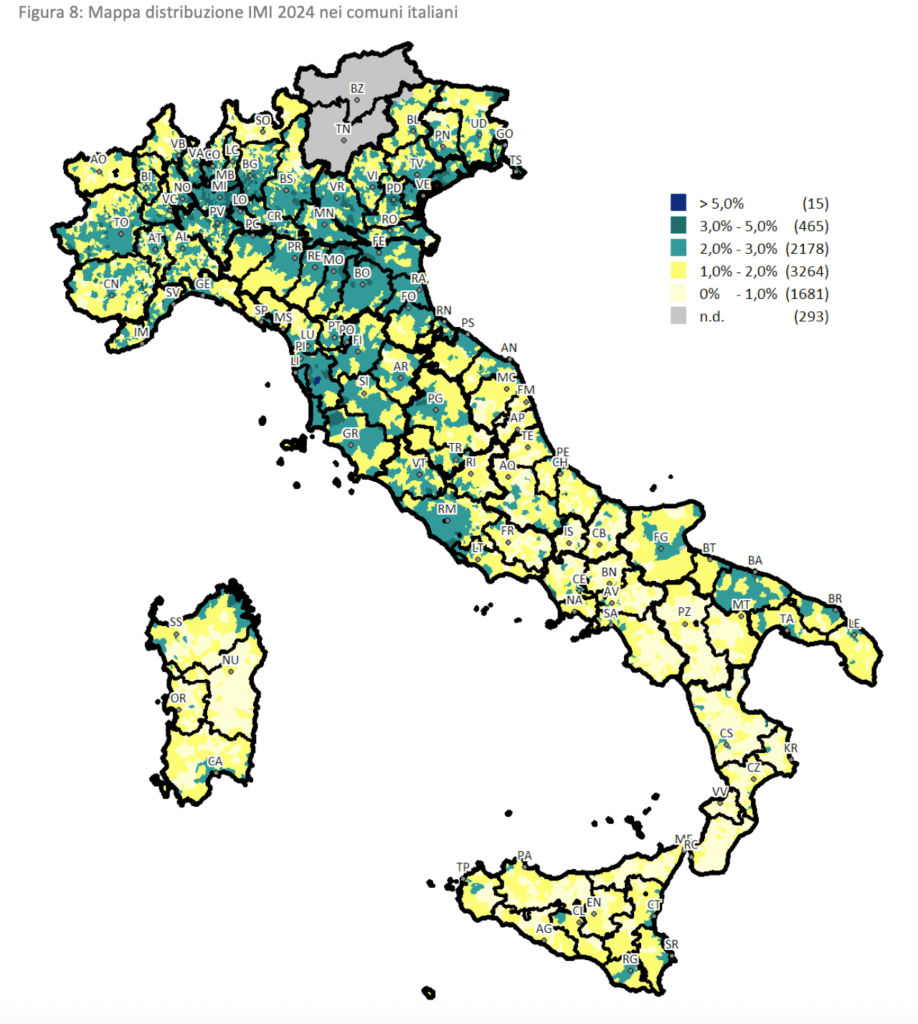
6. Which market is the most attractive?
In addition to the sheer number of transactions, it is also worth noting the activity of the markets in each region. This helps to better understand where the market is more dynamic and where it is showing signs of stagnation. The IMI index (Italian: Intensità del Mercato Immobiliare), which is used to assess the attractiveness and health of the housing market, shows the highest intensity in the northern regions of Italy – primarily Lombardy, Veneto and Emilia-Romagna, as well as in Tuscany, the Rome area (Lazio) and the Bari area (Apulia).
📈 The map below (Figure 8) shows the market intensity index in each Italian municipality in 2024.
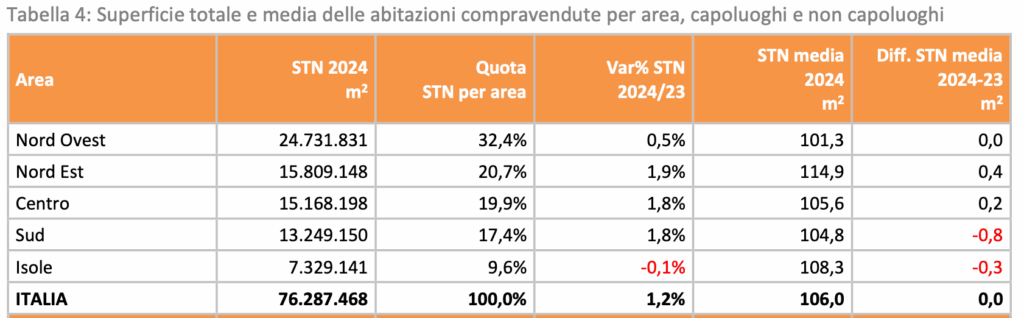
7. What is the average area of real estate in Italy?
In Italy, real estate prices are most often quoted in total terms, rather than per square meter, as in Poland. Such a method of presentation is also reflected in this report, so it is worth being aware of what area the indicated values refer to. According to the data published in this report, the average area of apartments sold in 2024 was 106 sq. m.
It is worth noting, however, that the square footage of sold properties varies from region to region:
- Largest properties: Northeast (Nord Est) – 114.9 m².
- Smallest properties: South (Sud) – 104.8 m².
📈 The table below (Tabella 4) shows the average size of residential properties in Italy (STN media 2024 m2) by region (Nord Ovest – northwest, Nord Est – northeast, Centro – center, Sud – south, Isole – islands) in 2024.
8. Properties in Italy of what size are most likely to be purchased?
In 2024, the largest number of transactions involved apartments of 50-85 sqm and 85-115 sqm. Together they accounted for almost 60% of all sales contracts. From an investor’s perspective, this is important information – it indicates high demand in these ranges, and thus greater chances for easier and faster resale in the future.
- 50-85 m² – 224,741 transactions
- 85-115 m² – 190,727 transactions
📈 The table below (Tabella 5) shows the number of transactions in 2024 by property size: up to 50m², 50 – 85m², 85 – 115m², 115 – 145m², above 145m².
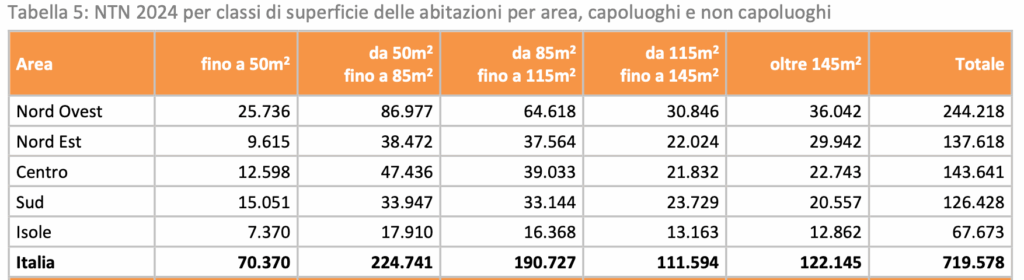
In the context of property area, it is worth noting that Italians consider units up to about 60 m² to be small apartments, and are reluctant to go for them. The data in Table 5 confirm this – apartments under 50 m² account for the lowest number of transactions: only 70,370 nationwide.
9. What is the value of the Italian residential real estate market?
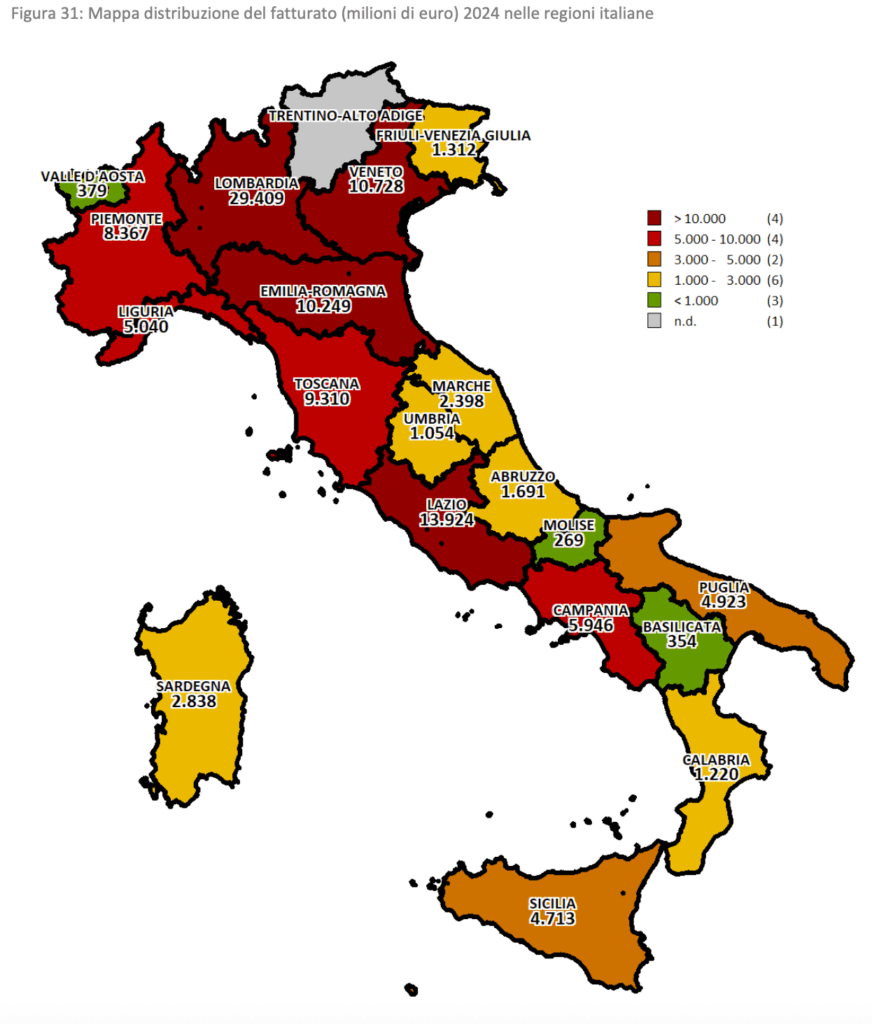
The total value of the real estate market is affected by two key factors: the number of transactions and the price level. In 2024, the Italian housing market is valued at about €114 billion, up €2.5 billion from the previous year. Against this background, the largest and most economically active regions clearly stand out:
- Lombardy – about €30 billion (more than 1/4 of the total market value)
- Lazio – about €14 billion
- Veneto – about €11 billion
- Emilia-Romagna – about €10 billion
In contrast, the smallest market was recorded in Basilicata, Molise and the Aosta Valley – all with a value of less than €1 billion.
📈 The map below (Figure 31) shows the market value of each region in 2024.
10. Current real estate prices in Italy
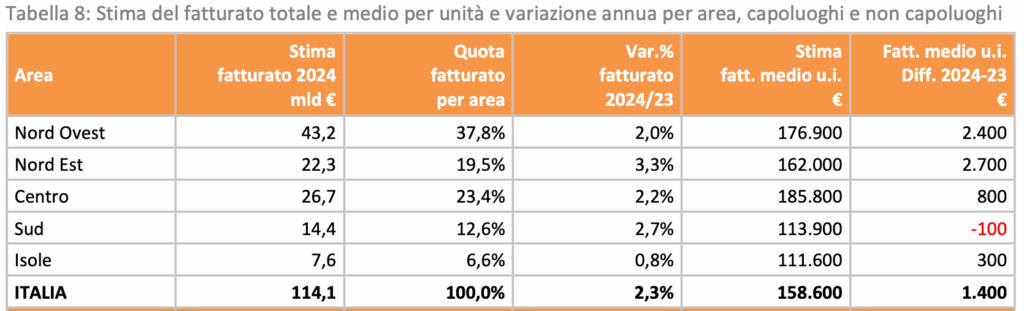
In 2024, nearly 60% of the value of Italy’s real estate market was generated by transactions in the northern part of the country , which once again underscores the dominant role of the area.
Average prices by geography:
- Italy: €158,600
- Center: €185,800
- Northwest: 176 900 €
- Northeast: 162 000 €
- South: €113,900
- Islands (Sicily, Sardinia): 111 600 €
📈 The table below (Tabella 8) shows the average property prices (Stima fatt. Medio u.i. €) in 2024 by region (Nord Ovest – northwest, Nord Est – northeast, Centro – center, Sud – south, Isole – islands).
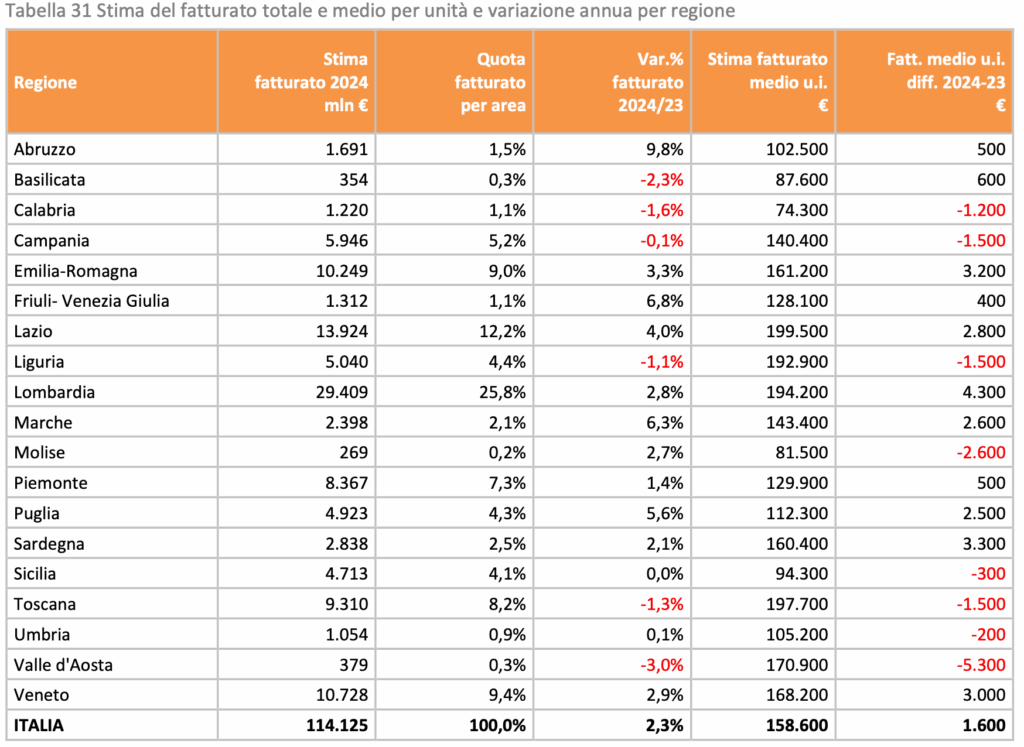
11. Property prices by region
In terms of average transaction prices at the regional level, compared to the national average price of €158,600, the most expensive markets are the northern ones, with an average of around €200,000, and the cheapest are the southern ones with an average of less than €100,000.
Most expensive regions:
- Lazio: €199,500
- Liguria: €192,900
- Lombardy: €194,200
- Tuscany: 197 700 €
Cheapest regions:
- Basilicata: 87 600 €
- Calabria: 74 300 €
- Molise: €81,500
- Sicily: €94,300
📈 The table below (Tabella 31) shows average real estate prices (Stima fatturato medio u.i. €) in 2024 by region.
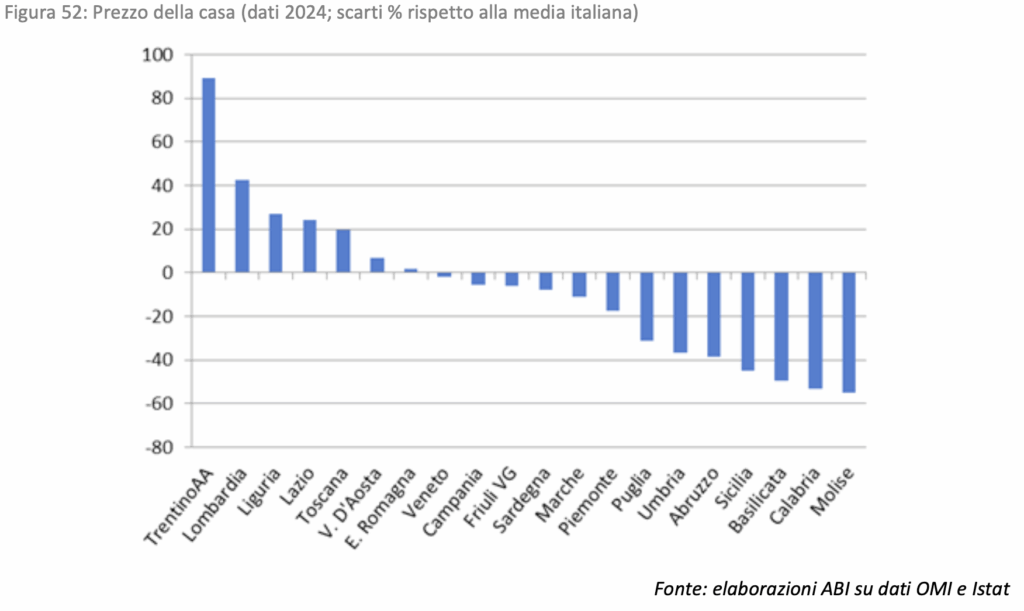
📈 The chart below (Figure 52) shows the average property prices in each region, ordered from highest to lowest. The chart also indicates the percentage by which prices in each region deviate from the national average, marked as level “0”.
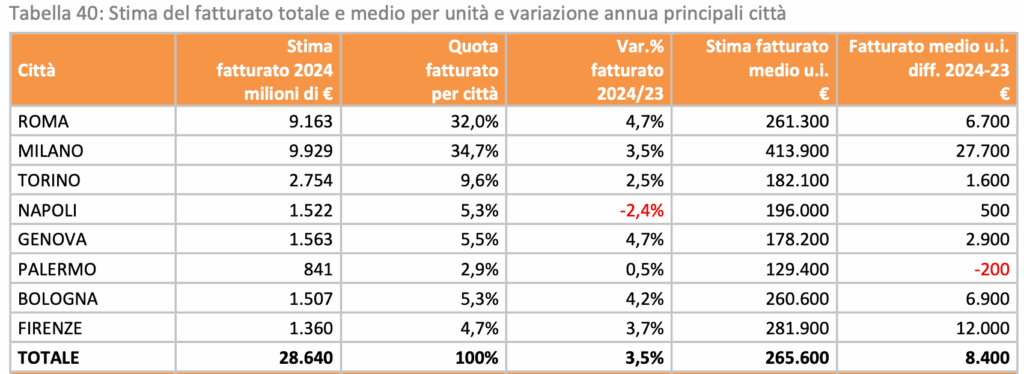
12. Property prices in major cities
The report also includes data on real estate prices in eight of Italy’s largest cities – Rome, Milan, Turin, Naples, Genoa, Palermo, Bologna and Florence – to better illustrate the overall market and identify locations that deviate significantly from average prices, thereby influencing price overvaluation in each region.
The most expensive of these:
- Milan: €413,900
- Florence: €281,900
- Rome: €261,300
Cheapest:
- Palermo: €129,400
- Genoa: €178,200
- Turin: €182,100
📈 The table below (Tabella 40) shows average real estate prices (Stima fatturato medio u.i. €) in 2024 by city.
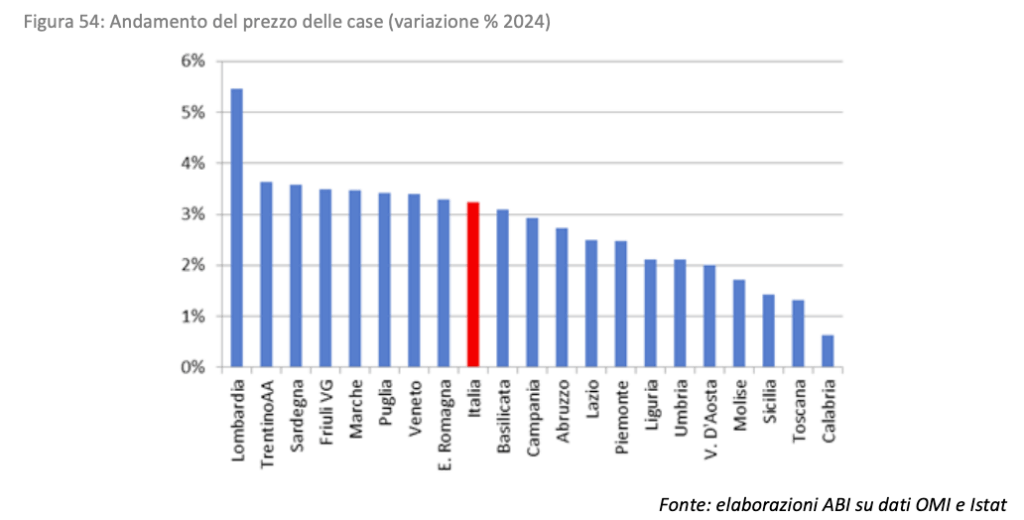
13. Real estate in Italy – Where did prices rise fastest?
With property prices in Italy on the rise again, it is worth looking at which regions saw the fastest price growth and where the market showed less momentum.
In 2024, the largest increase in real estate prices was recorded in Lombardy, a region with a strong economy and high demand. Average prices there rose by 5.5% year-on-year. This is clearly above the national average, which was just over 3% for Italy as a whole.
At the opposite pole were regions such as Sicily, Tuscany and Calabria, where price dynamics were much lower. In these areas, increases were symbolic – from 0.6% to 1.5%.
📈 The chart below (Figure 54) shows the increase in real estate prices in 2024, relative to prices in 2023, by region.
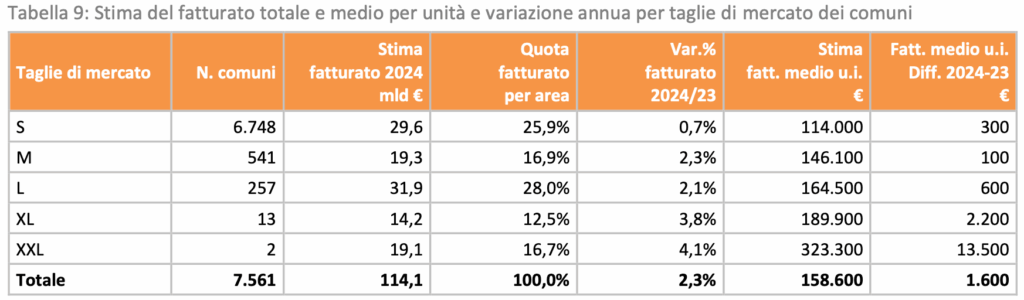
It is additionally worth noting that in 2024 price increases were observed in all cities – from the smallest (S) to the largest (XXL). However, the most significant changes were observed in the two largest cities (XXL) – Rome and Milan. The average price increase there in 2024 was €13,500 year-on-year, well above the national average of €1,600. This may be the result of very high base prices – the average price of a property in Milan is as high as €413,900 – almost three times the national average.
📈 The table below (Tabella 9) shows property prices (Stima fatt. Medio u.i. €) in 2024, and the value of the price change (Fatt. medio u.i. Diff. 2024-23 €) with respect to 2023 by city size S, M, L, XL, XXL.
14. Italian housing market – what to remember from 2024
GENERAL MARKET SITUATION
- After years of stagnation due to the 2008 crisis, the Italian real estate market is gradually regaining its momentum. This can be seen both in the increasing number of transactions and in rising prices, which are now approaching pre-crisis levels.
- In 2024, the Italian housing market is reported to have more than 719 thousand transactions , of which more than half took place in the northern regions. Among the largest cities, Milan and Rome stand out – a total of about 60 thousand transactions took place there. Also noteworthy is Turin, where more than 15 thousand buy-sell agreements were concluded in 2024.
- An important role in the market structure is played by the smallest towns, where more than 250,000 transactions – accounting for 36.1% of the total volume.
- In 2024, residential markets in Puglia (Bari), southern Sicily and northern Sardinia (Sassari, Costa Smeralda) were particularly active. In addition, invariably, there was also strong interest along the coast – especially in Tuscany, Lazio, Campania, Veneto, Emilia-Romagna and northern Marche.
- In terms of overall market condition, the best performing regions were: Lombardy, Veneto, Emilia-Romagna, Tuscany, Lazio (especially around Rome) and Puglia (Bari region).
- In 2024, the average area of apartments and houses sold was 106 m². The largest was in northeastern Italy – 114.9 m². The smallest in the south – 104.8 m². Properties between 50 and 115 m² were the most popular – together they accounted for almost 60% of all transactions. Apartments smaller than 50 m² were the least popular and accounted for less than 10% of transactions.
- In 2024, the total value of Italy’s residential real estate market is about €114 billion. This is an increase of €2.the the the an earlier year.
- Lombardy – about €30 billion (more than ¼ of the total market),
- Lazio – about €14 billion,
- Veneto – about €11 billion,
- Emilia-Romagna – about €10 billion.
In contrast, the smallest market value was recorded in the regions: Basilicata, Molise and Aosta Valley – all below €1 billion.
AVERAGE PRICES
- The average price of residential real estate in Italy in 2024 was €158,600. However, it is worth noting the large regional variation – the north of the country is definitely more expensive than the south. Average prices in different parts of Italy are as follows:
- Center: €185,800
- Northwest: €176,900
- Northeast: €162,000
- South: €113,900
- Islands (Sicily and Sardinia): €111,600
PRICES IN THE REGIONS
- In terms of average transaction prices at the regional level, the most expensive markets are the northern ones, with an average of around €200,000, and the cheapest are the southern ones with an average of less than €100,000.
The most expensive regions are:
- Lazio: €199,500
- Liguria: €192,900
- Lombardy: €194,200
- Tuscany: €197,700
The cheapest regions are:
-
- Basilicata: €87,600
- Calabria: €74,300
- Molise: €81,500
- Sicily: €94,300
- In 2024, the largest price increase was in Lombardy – by 5.5% year-on-year (with average national growth of just over 3%). The smallest increases took place in Sicily, Tuscany and Calabria – they are in the range of 0.6-1.5%.
- In large cities, the price spread is as pronounced as in the regions:
The most expensive major cities are:
- Milan: €413,900
- Florence: €281,900
- Rome: €261,300
The cheapest major cities are:
-
- Palermo: €129,400
- Genoa: €178,200
- Turin: €182,100
SUMMARY
The decision to buy property in Italy should be well thought out and tailored to the goal we want to achieve. Depending on the intention, a different region will work well if you are buying for personal use, and another when you are planning an investment. It is worth remembering that an attractive price is only one factor. So if you are thinking of an investment purchase, it is worth analyzing, among other things, potential demand, anticipated price trends and ease of possible resale.
The entire report in Italian can be found at the following link:
https://www.agenziaentrate.gov.it/portale/documents/d/guest/ri2025_residenziale20250520
And for more information, please feel free to contact us:
UDOSTĘPNIJ NA: